Import Data
Go to the Data tab in the Template, which will contain the imported data once the process is complete.
To begin, right-click Data and select Add. This will open the Create Data Wizard, at Step 1 – General Settings.
The following screen will appear:
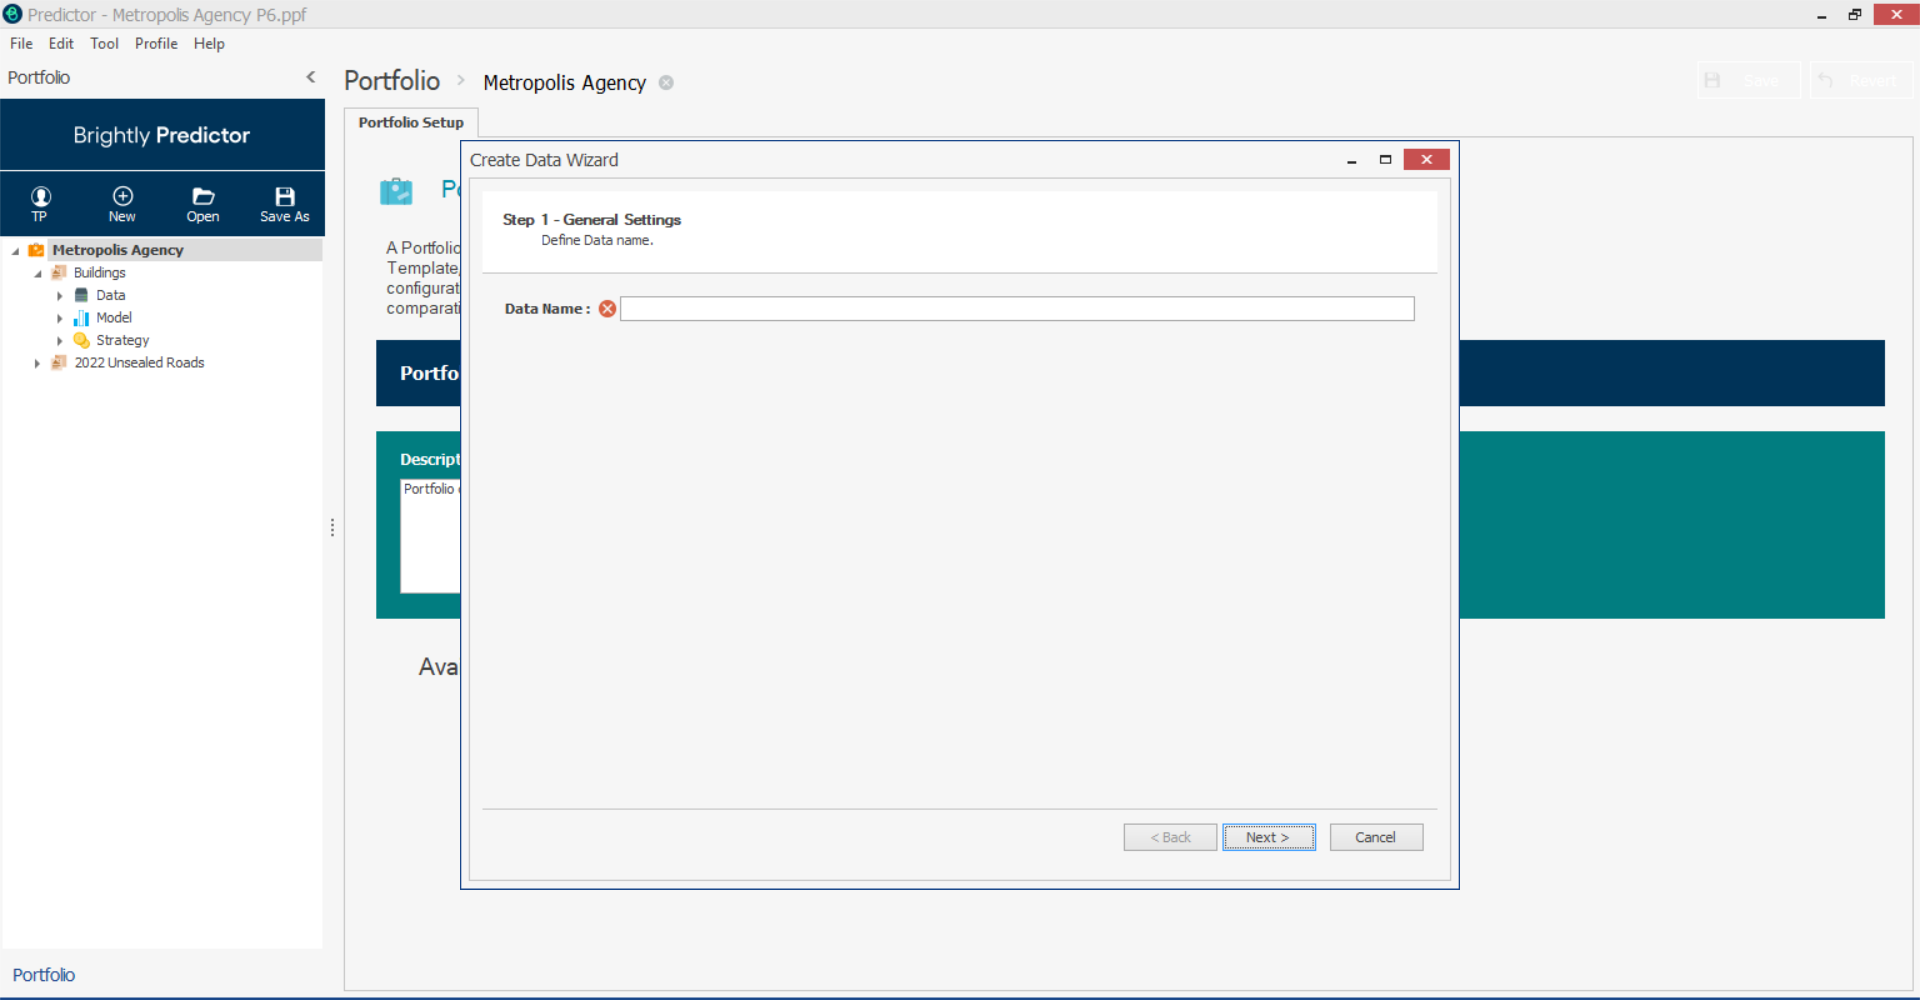
Name the Data as it will appear in the Portfolio, then click Next, and the Data Source Import pop-up will appear:
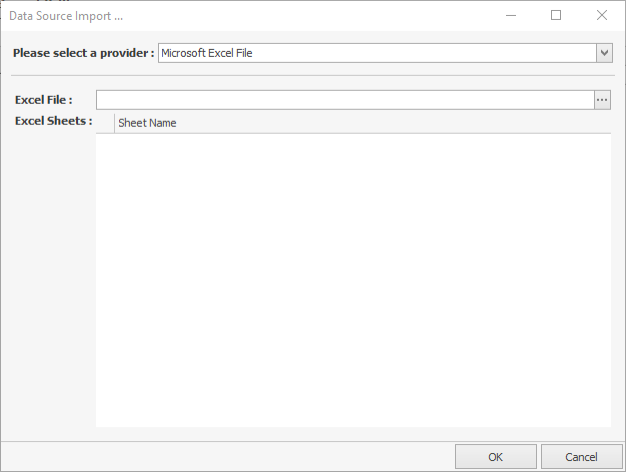
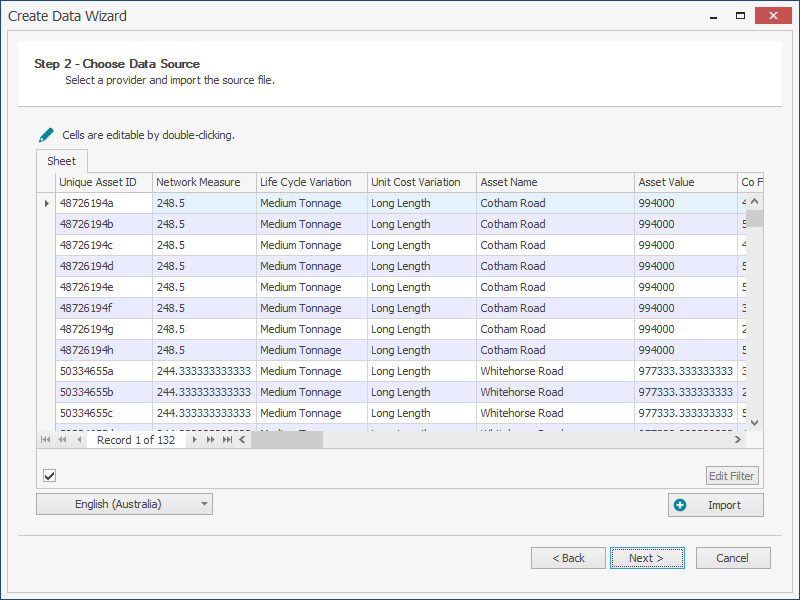
Click 'OK' once the import file has been selected (the default file type is Excel), and the wizard will move to Step 2 - Choose Data Source:
Note: The region setting will determine which date format and decimal point mark is used, and will default to the system settings. For performance reasons, the number of rows imported should be limited to 800,000 or fewer.
Check that the correct file is imported. If the correct file has not been imported, the 'Import' button can be used to re-select the correct file.
This step allows the user to confirm the validity of the file and the availability of all relevant data fields that may be required in modelling for the next steps.
- If OK, click Next
The following screen for Step 3 – Mapping, will appear:
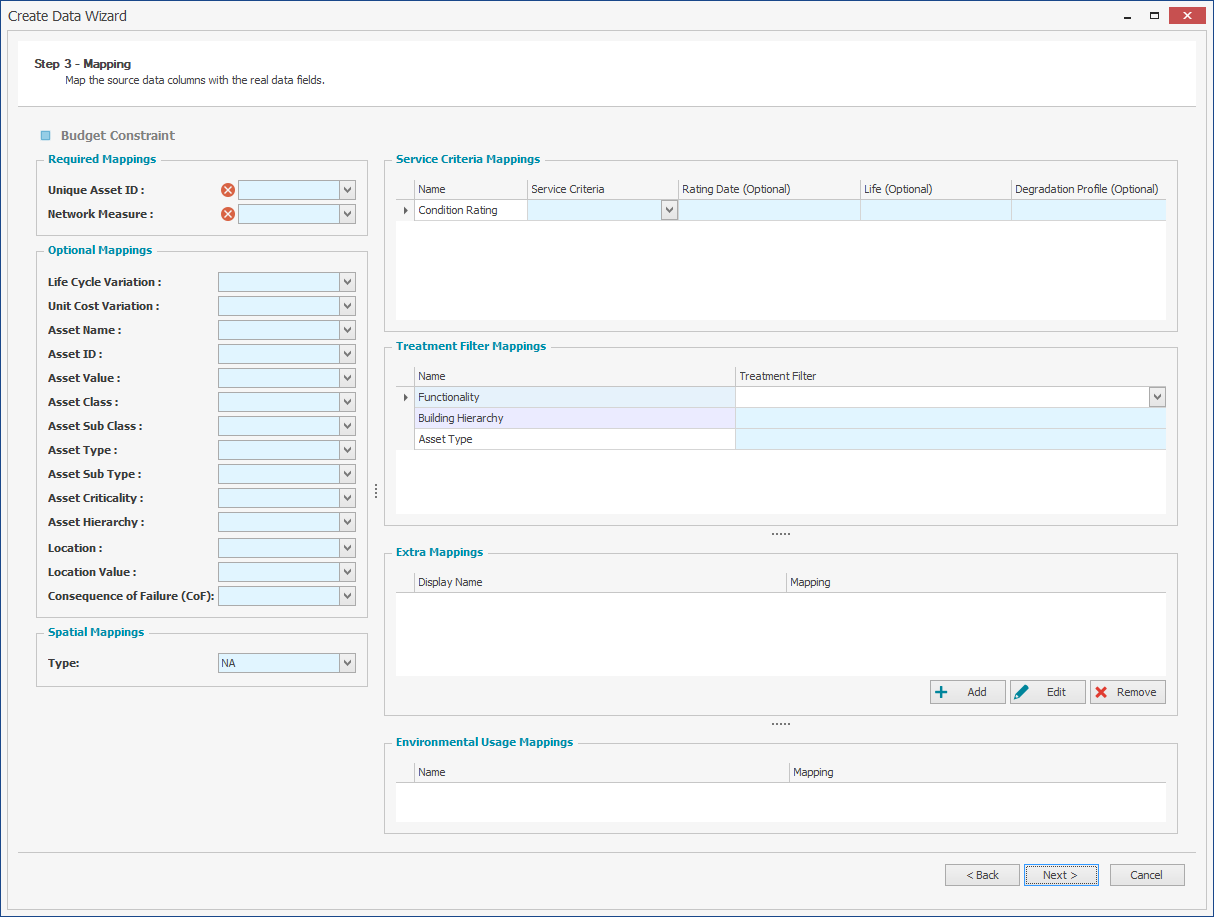
Here, map the Input Data Fields to relevant fields in Predictor, by clicking on the drop-down menu of each field. All data column headers from the input file are visible, so select the relevant data column for each field.
Required Mappings:
- Unique Asset ID: Each asset in the input data sheet must have a unique identifier.
- Network Measure: Network measure is used to indicate the absolute or relative size of the assets in a template. This can correspond to the physical size of the assets, such as the trafficable area for roads, length for pipes and floor area for buildings, or renewal cost, such as for buildings.
Optional Mappings:
- Life Cycle Variation: If assets in imported data have different useful lives, Life Cycle Variation can be used to distinguish assets from predominant useful life.
- Unit Cost Variation: The same treatment on different assets may incur different treatment costs. This can be due to location, criticality, or any specific nature of assets.
- Asset Name: It is recommended that Users provide an asset name for each of the assets, as this is helpful in identifying assets.
- Asset ID: If there is an asset ID, (eg. a third party system ID), that is different to the unique asset ID, Users can map them to Asset ID.
- Asset Value: This is typically the unit replacement rate for the asset.
- Asset Class: One of a number of fields that can be filtered against when viewing Predictor Web App reports.
- Asset Sub Class: One of a number of fields that can be filtered against when viewing Predictor Web App reports.
- Asset Type: One of a number of fields that can be filtered against when viewing Predictor Web App reports.
- Asset Sub Type: One of a number of fields that can be filtered against when viewing Predictor Web App reports.
- Asset Criticality: One of a number of fields that can be filtered against when viewing Predictor Web App reports.
- Asset Hierarchy: One of a number of fields that can be filtered against when viewing Predictor Web App reports.
- Location: One of a number of fields that can be filtered against when viewing Predictor Web App reports.
- Location Value: This field mapping is only available for Buildings and Facilities type categories, and is used for the FCI calculation in the Location Backlog report. If multiple Location Values are mapped to the same Location, the maximum value is used.
- Consequence of Failure (CoF): If risk factors are to be used in modelling, then each Asset needs to be assigned a Consequence of Failure value, which is a whole integer within the Minimum and Maximum CoF range specified in the Template's Advanced Setup.
Spatial Mappings
- Type: Select the type of the spatial data to be mapped from the source data, if there is any. If the data source was Esri, the type dropdown will be locked to 'esrilayer'. If another data source is used, the 'Coordinate' type can be selected. Spatial Mappings are currently used by Work Planner, a licensed feature.
- CoordX (Long): Visible only when the 'Type' is set to Coordinate, this maps the longitude.
- CoordY (Lat): Visible only when the 'Type' is set to Coordinate, this maps the latitude.
Service Mappings:
- Service Criteria: Map the Service Criteria to the relevant column in the import data.
- Rating Date (Optional): Map the Rating Date for a Service Criteria to the column in the import data. If the field is left unmapped, or the imported cell for a specific asset is blank, then the Rating Date will default to the current date.
- Life (Optional): Map the Life for a Service Criteria to the column in the import data. If the field is left unmapped, or the imported cell for a specific asset is blank, then the value will default to the default life value configured in the Life Cycle tab of the Model.
- Degradation Profile (Optional): Map the Degradation Profile for a Service Criteria to the column in the import data. If the field is left unmapped, or the imported cell for a specific asset is blank, then the Degradation Profile used will default to the value configured in the Life Cycle tab of the Model.
Treatment Filter Mappings:
- Treatment Filter: For each Treatment Filter name as defined in the Portfolio Template, a column is mapped from the import data.
Extra Mappings:
- Users can add any number of extra mappings, as required, using the 'add' button in the Extra Mappings box. Extra mappings can be used in some reports.
Environmental Usage Mappings:
Note: this is a licensed feature, and these mappings will only appear when the feature is enabled.
- Each Environmental Parameter that has been configured in the template will appear in this section, and can be mapped column from the import, with numeric values corresponding to the environmental usage.
After all the mappings are completed, click Next to go to Step 4 - Scaling
The Scaling step is where raw asset data is converted into service criteria. Data needs to be scaled for modelling purposes. The default scale in Predictor is a numerical scale, from State 0 to 6, based on IIMM and NAMS guidelines. Imported data can be scaled 'Direct to State' when the import data is using 0-6 values, or a 'Custom' scaling can be used to scale imported data to the 0-6 system. Predictor also supports 'Direct to Native Scale', where imported numeric values retain their Native scaling system, and 'Direct to Service Potential', where imported values will be correlated from percentage (0 to 1) values to the selected Degradation Profile. Predictor assists with setting scales by displaying the raw data values that it has detected in the asset data file.
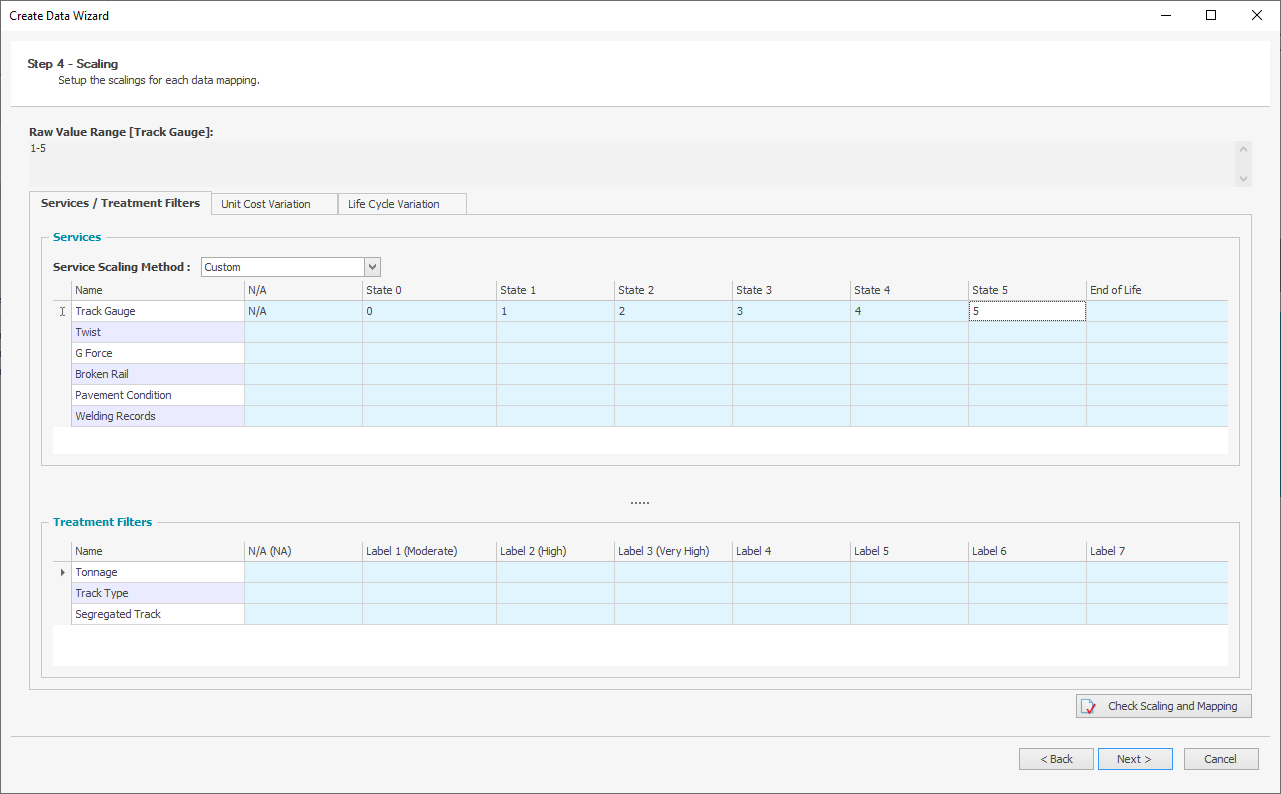
Note: N/A (Not Applicable) can be used where the specified criterion is irrelevant for a particular asset. For example, if a user is modelling sealed and unsealed roads together, for unsealed roads the surface condition is irrelevant. In this case for unsealed roads surface condition, users can put N/A.
Numeric ranges can be mapped to a state using a dash (e.g. 1-3), one or more Alphanumeric values can be mapped using a semicolon (e.g. Corrugate Iron; Roof Tiles), and blank cells in the import data for Service Criteria or Treatment Filter Scaling can be mapped using 'ISBLANK':
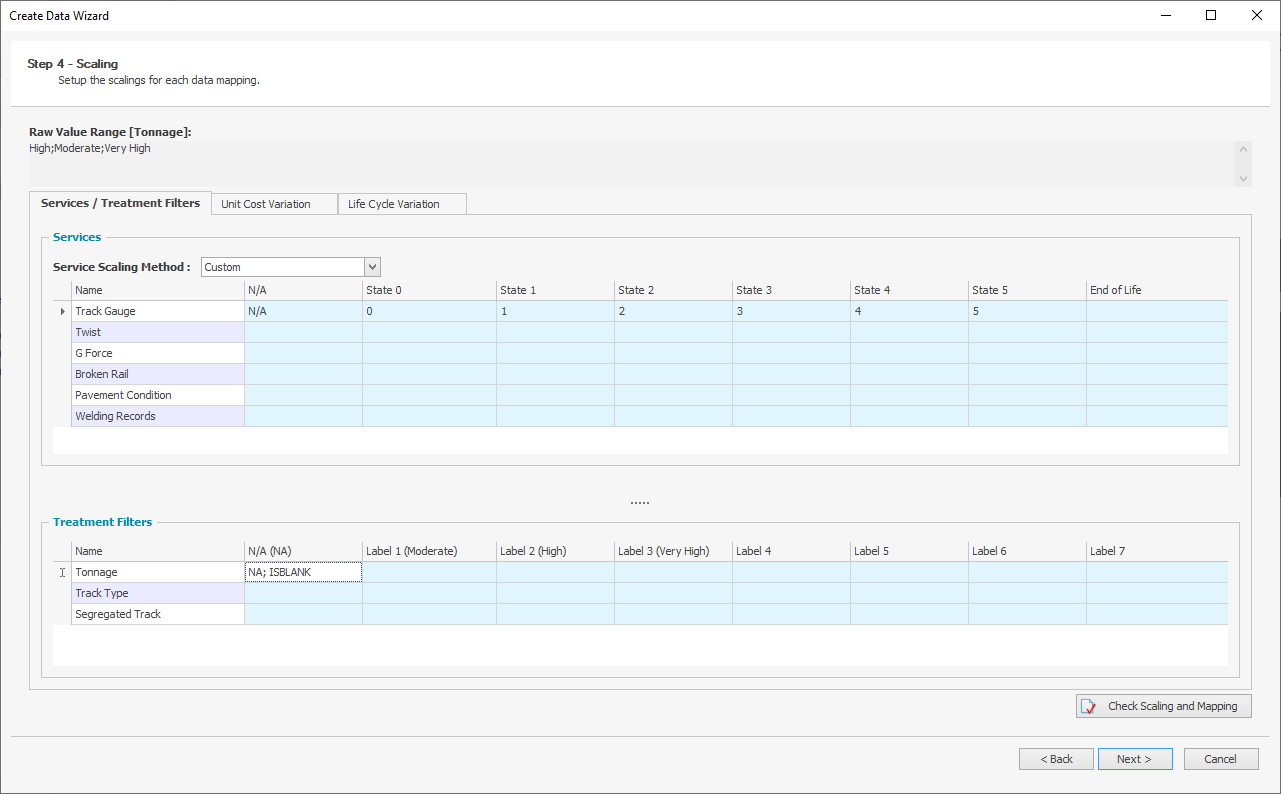
Note: When there are overlapping scaling ranges, Predictor will use the higher condition state as the result of the scaling. For example, if a user is scaling 0-2 to be State 1, and 2-4 to be State 2, then an import of exactly 2 would result in State 2.
The Scaling can be checked at any time by using the Check Scaling and Mapping button.
Unit Cost variations and Life Cycle variations can be configured on the appropriate tabs, which will appear if Unit Cost and Life Cycle variations are in use in and mapped:
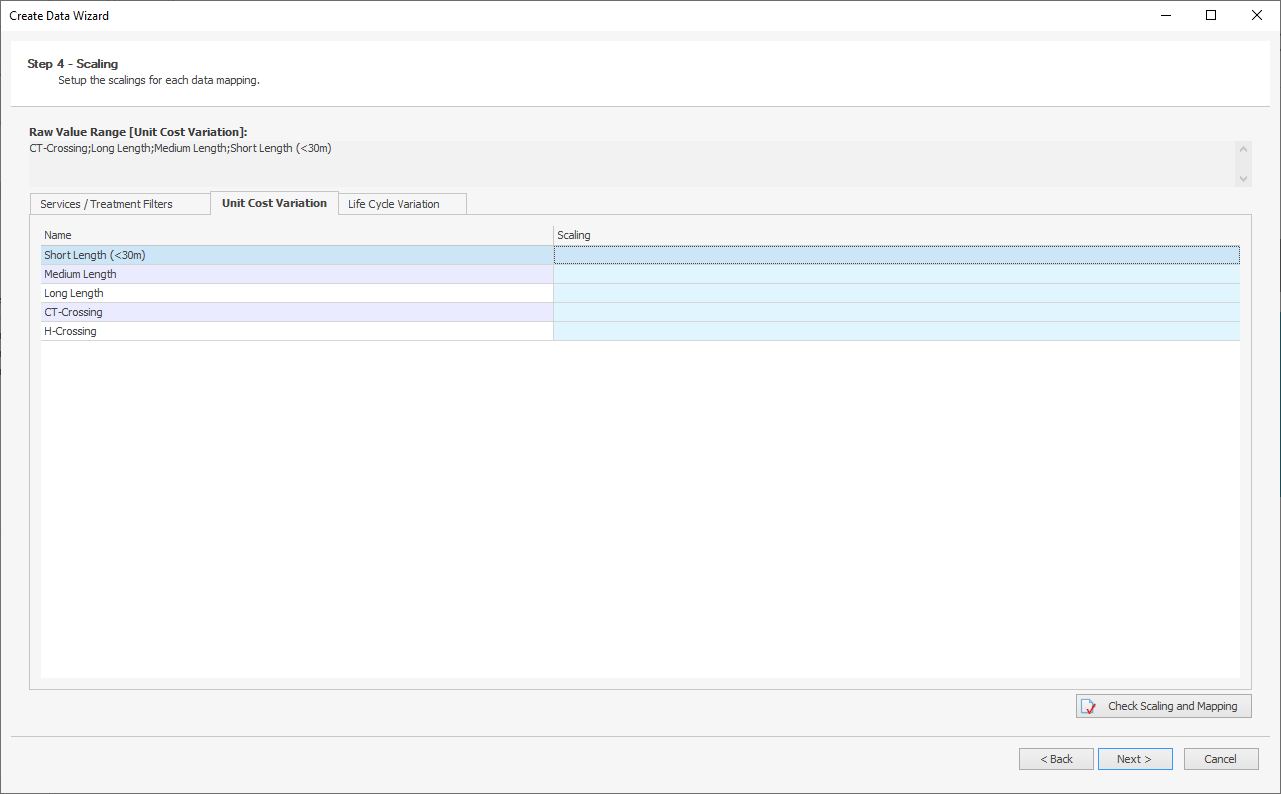
Multiple Scalings can be configured in bulk by right-clicking and pasting.
- Click Next after Scaling Check is completed. The screen showing that the User has completed data importing will appear.
- Click Finish to exit the Data Import Wizard, or to go back and change any data mapping click Back.
